 EN
 English
 中文简体
 Français
 Español
 Latine
 عربى

Industry News
Sofa Cushion Foam Compression Testing Standards: ASTM D3574, ISO 3386 & More
Content
- 1 What Sofa Cushion Foam Compression Testing Actually Measures
- 2 The Standards Family Behind a Cushion Specification
- 3 How a Compression Test Is Actually Run
- 4 Reading the Numbers: Typical Ranges for Sofa Cushion Foam
- 5 The Five Numbers That Sit Next to Hardness on a Spec Sheet
- 6 Where the Standards Diverge by Region
- 7 Five Testing Mistakes That Quietly Change the Result
- 8 How We Test Compression in Our Own Foam Laboratory
- 9 From Laboratory Data to a Sofa You Can Actually Sit On
- 10 Frequently Asked Questions About Foam Compression Testing
- 10.1 What is the difference between IFD and CFD?
- 10.2 What compression set value should a sofa cushion foam have?
- 10.3 How long should foam rest before it is tested?
- 10.4 Does density determine firmness?
- 10.5 Which standard applies to sofa cushions in Europe?
- 10.6 Can compression testing predict how long a cushion will last?
- 10.7 Does vacuum compression change compression performance?
- 10.8 What specimen size is used for IFD testing?
A sofa cushion looks like a simple object: a block of flexible polyurethane foam, sometimes wrapped in fibre or memory foam, tucked inside a fabric cover. Yet the way that block responds to being sat on thousands of times, through humid summers and dry winters, is governed by a set of measurable properties, and every one of those properties has a test method behind it.
If you have ever replaced a cushion that went flat long before the sofa frame showed any wear, you already have a feel for why compression testing standards matter. They are the reason two cushions that look identical in a showroom can behave completely differently two years later.
This guide walks through the compression testing standards that shape sofa cushion foam today, including ASTM D3574, ISO 3386, ISO 2439 and ISO 1856, along with their Chinese GB/T equivalents. We will look at what each number on a foam specification actually tells you, where the methods differ between regions, and which mistakes quietly change test results in real laboratories.
What Sofa Cushion Foam Compression Testing Actually Measures
Compression testing is not one test. It is a family of procedures that answer four different questions about the same block of foam: how much force it takes to press the foam down, how much of that force returns when the load is removed, how much thickness is lost permanently, and how the material changes after heat, humidity and long-term loading. Two of those procedures carry most of the weight in everyday sofa specifications.
Indentation Force Deflection (IFD)
IFD is the showroom number. A circular platen presses into a large foam specimen and records the force required at a defined deflection, most commonly at 25 percent and 65 percent of the original thickness. Under ASTM D3574 Test B1, the specimen is typically a full slab section around 380 by 380 by 100 millimetres, and the platen is smaller than the specimen, so the foam is free to bulge sideways.
That geometry is deliberate. It mimics a seated body pressing into a cushion, where the load is local and the surrounding foam can move. This is why a seat cushion feels softer than the IFD figure alone might suggest, and why the same foam tested on a rigid plate can look considerably firmer.
Compression Force Deflection (CFD)
CFD is the engineering number. A smaller specimen is compressed between two flat plates, so the whole surface is loaded evenly and there is far less room for the material to bulge. The result is normally reported at a single deflection, often 25 percent or 50 percent, depending on the product and the standard being followed.
CFD is more useful for thin sections, laminated layers, moulded parts and cushion wraps, where the platen used for IFD would be wider than the part itself. For a sofa cushion built from several layers of foam, CFD tells you how each layer behaves inside the stack rather than how the assembly behaves as a whole.
In practice, a well-written sofa cushion specification often quotes both, because they describe two different physical situations. IFD answers what a person feels when they sit down. CFD answers what the foam does when it is loaded evenly inside a structure that cannot move.
The Standards Family Behind a Cushion Specification
Standards bodies have converged on remarkably similar ideas, even though the names and units differ. In North America, ASTM D3574 remains the single reference document that most foam suppliers, furniture brands and testing laboratories work from, and it bundles density, hardness, compression, tensile, tear and resilience methods into one standard. In Europe and much of the rest of the world, the work is split across several ISO documents. China's GB/T methods mirror the ISO approach closely, which is why most export-oriented factories report results in both formats.
| Standard or test | Typical region | What it measures | How it is reported |
|---|---|---|---|
| ASTM D3574, Test B1 | North America | Indentation Force Deflection on a full slab specimen | Force at 25% and 65% deflection, plus support factor |
| ASTM D3574, Test C | North America | Compression Force Deflection on a small specimen | Force at a chosen deflection, often 25% or 50% |
| ASTM D3574, Test D | North America | Static compression set after heat ageing | Percentage of thickness lost after 22 hours at 70 degrees Celsius |
| ISO 2439 | Europe and international | Indentation hardness of flexible cellular materials | Hardness at defined indentations, commonly 25% and 65% |
| ISO 3386, Parts 1 and 2 | Europe and international | Compressive stress-strain behaviour, split by density range | Compression load deflection at 25% and 40%, plus sag factor |
| ISO 1856 | Europe and international | Compression set under constant deflection | Percentage set after a defined time and temperature |
| GB/T 10807 | China | Indentation hardness, aligned with ISO 2439 | Hardness values at 25% and 65% indentation |
| GB/T 6669 | China | Compression set, aligned with ISO 1856 | Percentage set under defined conditions |
For a furniture brand buying across regions, the practical takeaway is that a 25 percent IFD figure and a 25 percent CLD figure are not interchangeable numbers, even though both describe hardness. They come from different specimen sizes, different conditioning routines and different deflection sequences. A specification that mixes the two without saying so is the single most common source of confusion in foam purchasing.
How a Compression Test Is Actually Run
Published standards describe the procedure, but the sequence below reflects what a working foam laboratory does on a normal production day. Small differences in any of these steps can shift a result by five to fifteen percent, which is enough to move a foam from one firmness band into the next.
- Maturation. Freshly produced foam is allowed to rest in its natural state, commonly for around 72 hours, before any specimen is cut. Foam that is tested too soon reads softer and less stable than it will be after the reaction has fully settled.
- Conditioning. Cut specimens are conditioned at a controlled atmosphere, typically 23 degrees Celsius plus or minus 2 degrees and 50 percent relative humidity plus or minus 5 percent, so that every sample in a comparison starts from the same moisture and temperature state.
- Specimen preparation. For IFD, the specimen is a rectangular slab with square, parallel edges, free of skin, voids and visible mould lines. For CFD or compression set, smaller pieces are cut to the exact dimensions named in the method.
- Machine setup. A universal testing machine is fitted with the correct platen, the load cell is verified, and the crosshead speed is set, usually 50 millimetres per minute for indentation work. Platen diameter matters: a change in contact area changes the result.
- Loading sequence. The platen presses the specimen to the first target deflection, holds for a defined dwell time, records the force, then continues to the second target deflection and records again. Some methods add a pre-flex cycle to break in the cell structure before measurement.
- Calculation. The recorded forces produce the headline numbers: 25 percent IFD, 65 percent IFD, and the support factor, which is the 65 percent value divided by the 25 percent value. On a separate cycle, the difference between the loading and unloading curves gives the hysteresis or energy loss figure.
- Compression set. A separate specimen, often a stack of thin discs, is compressed to 50 percent of its original thickness and held at elevated temperature, commonly 70 degrees Celsius for 22 hours. It is then released, allowed to recover, and measured again. The difference in thickness, expressed as a percentage, is the compression set.
- Reporting. A useful report states the standard followed, specimen geometry, conditioning time, platen size, deflection sequence and dwell times. Without those details, a single hardness figure is nearly meaningless.
Reading the Numbers: Typical Ranges for Sofa Cushion Foam
The chart below shows indicative 25 percent IFD ranges for different seating roles. These are working ranges rather than fixed rules, because cover tightness, wrap layers and cushion depth all shift the final feel. They are, however, a reasonable starting point when a brand is writing a specification for the first time.
Companion values worth writing into the same specification
A cushion specification that names only hardness is half finished. Hardness tells you how the foam feels on day one. Density, support factor, compression set and resilience together tell you how it will feel in year three, which is the number most customers actually care about.
The Five Numbers That Sit Next to Hardness on a Spec Sheet
Experienced foam buyers rarely argue about a single figure in isolation. They read the specification as a set of related values, because the properties interact with each other and a weakness in one usually shows up as a complaint about another.
Support factor
Also called the compression modulus or sag factor, this is the 65 percent value divided by the 25 percent value. Conventional foam often sits near 1.6 to 2.0, while high resilience grades push past 2.2. A higher support factor means the cushion firms up progressively as it compresses, instead of bottoming out under a heavier sitter.
Compression set
The percentage of thickness permanently lost after prolonged compression under heat. Lower is better. It is the closest laboratory proxy for the sag that appears in a well-used sofa.
Hysteresis
The energy lost between the loading and unloading curves. Lower hysteresis means the foam returns energy rather than absorbing it, which is what a springy, responsive cushion feels like underfoot.
Resilience
Measured with a steel ball dropped onto the foam, with the rebound height expressed as a percentage. High resilience foam typically returns above 50 percent, which correlates strongly with a lively rather than dead feel.
Density
Not a compression result, but the ceiling on durability. Foam below roughly 25 kilograms per cubic metre may test well when new and still lose support quickly, because there is simply less material resisting fatigue.
Compression set deserves special attention because it is the value that most closely tracks real-world complaints. A seat foam that records a set above ten percent after 22 hours at 70 degrees Celsius has already told you something about how it will behave after two summers in a warm living room. In our own testing, we treat anything close to double digits as a warning sign and revisit the formulation rather than the marketing description.
 Custom Solid Memory Foam Mattress for OEM and Hotel ProjectsA coil-free layered memory foam mattress with 45D support base, customizable firmness, and vacuum-compressed packaging; compression-set testing helps predict body impressions.View Product →
The same logic travels across product lines. A mattress foam that loses ten percent of its thickness under compression set testing will show visible body impressions long before the cover wears out, and the testing programme that catches it is identical to the one used for seating foam.
Where the Standards Diverge by Region
Global furniture brands often discover that the same foam can be described three different ways depending on which market the specification originated in. That is not a contradiction; it is a difference in testing tradition.
North America
ASTM D3574 dominates. Results are usually reported in pounds-force per square inch or in pounds for IFD, on a 15 by 15 by 4 inch specimen, with the 25 percent figure treated as the headline hardness value. Compression set is expressed as a percentage and quoted alongside durability claims.
The culture here favours a single consolidated standard that covers density, hardness, tensile, tear and resilience in one document, which makes it convenient for procurement teams.
Europe
The work is split across ISO 2439 for indentation hardness, ISO 3386 for compression load deflection and ISO 1856 for compression set. Metric units are standard, and CLD is frequently reported at 40 percent compression rather than 25 percent, which alone can make a European datasheet look firmer than an American one.
Sag factor, rather than support factor, is the term most often used in conversation.
China and wider Asia
GB/T methods such as GB/T 10807 and GB/T 6669 are technically aligned with ISO, and export-focused factories very often run both ASTM and ISO procedures on the same production line. Dual reporting has become normal, because the same container of foam may be specified by a North American brand and inspected under a European standard.
For buyers, the practical rule is simple: always ask which standard and which deflection percentage produced the number on the sheet.
Five Testing Mistakes That Quietly Change the Result
Most disputed test results do not come from faulty equipment. They come from small procedural differences that nobody wrote down. These are the five we see most often, and each one is worth checking the next time two laboratories disagree.
Testing foam too early
Specimens cut and tested within hours of production read softer and recover more slowly. The maturation window exists for a reason, and skipping it shifts hardness downward by a measurable margin.
Ignoring humidity
Polyurethane foam is hygroscopic to a degree. A dry winter laboratory and a humid summer one can produce different readings from the same batch unless conditioning is controlled.
Cutting specimens with skin attached
The denser outer skin of a foam block behaves nothing like the interior. Leaving it on a test piece inflates the force readings and hides what the cushion core will really do.
Changing platen size between labs
Indentation results depend on the relationship between platen diameter and specimen area. A smaller platen on the same foam gives a different figure, even with everything else held constant.
Reporting one value as the whole story
A hardness figure without compression set, density and resilience is a snapshot of day one. It says nothing about whether the cushion will still be supporting a person comfortably two years later.
How We Test Compression in Our Own Foam Laboratory
We have been making polyurethane foam since 1996, starting with hand foaming and gradually moving to automated lines across two production bases in Zhejiang and Jiangxi. That history shapes how we test, because the failures we learned about early were rarely dramatic; they were cushions that slowly stopped doing their job.
Raw material control
Temperature and flow of the incoming components are logged continuously, with automatic metering pumps and PLC control managing the foaming and curing stages so that a formulation behaves the same way in July as it does in January.
Batch sampling
Every batch is sampled after maturation and conditioned before testing, so that hardness and compression set values reflect the foam as it will actually ship rather than as it emerged from the line.
Compression and recovery
Our in-house laboratory uses indentation hardness equipment, ball rebound testing and tensile testing to monitor density, hardness, resilience and strength, with compression set runs following the same 70 degree Celsius protocol used internationally.
Documentation
Results are recorded per batch under a quality management system certified to ISO 9001:2016, and finished products are regularly submitted for third-party verification so that customer specifications can be matched against independent data.
Visitors often ask why a foam manufacturer needs its own testing centre when independent laboratories exist. The answer is speed and honesty. When a formulation is adjusted, we want to know within a day whether the compression set number moved, not within a month. You can read more about the equipment and the production setup on our factory page.
 Vacuum-Compressed Sponge Sofa Range for Modular SeatingA range of frameless, vacuum-compressed modular sofas using high-density polyurethane foam, designed to recover shape after shipping for importers, retailers, and project buyers.View Product →
The payoff shows up in products that live or die by their compression behaviour, from modular seating to compressed foam sofas that must spring back to full shape after weeks in a shipping carton.
From Laboratory Data to a Sofa You Can Actually Sit On
Translating test values into a comfortable sofa is where experience matters more than any single figure. A wide, deep lounge seat distributes body weight differently from a compact dining bench, so the same foam can feel perfect in one and vague in the other. As a rough working rule, we aim for a support factor above 1.8 and a compression set under five percent for any cushion expected to hold its shape through daily use, then adjust hardness upward for deeper seats and downward for back cushions.
What we specify for a seat cushion
- Density of 28 to 40 kilograms per cubic metre depending on the price band
- 25 percent IFD matched to the intended seating role, not to a generic medium
- Support factor above 1.8 so the foam firms up rather than collapsing
- Compression set under five percent after heat ageing
- Ball rebound above 50 percent for high resilience grades
What we check before shipping
- Recovery time after vacuum compression and packaging
- Consistency between the top and bottom faces of the block
- Core and surface hardness after the cover is applied
- Batch-to-batch variation within agreed tolerance bands
- Documentation that matches the buyer's declared standard
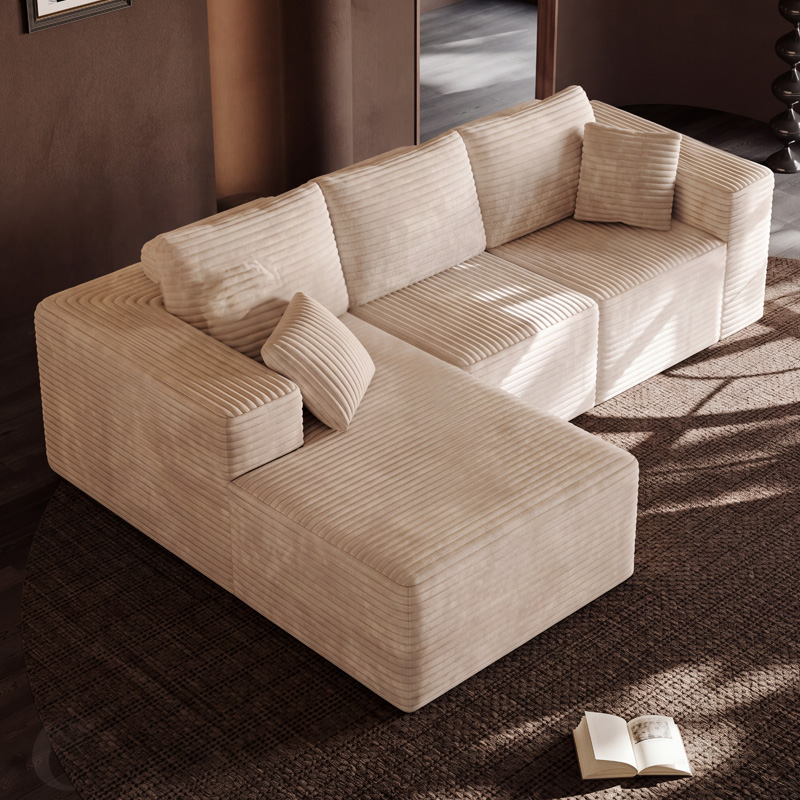
 46-Inch Extra-Wide Deep Chaise Lounge with CorduroyThis 46-inch chaise offers deep, wide seating with long-pile corduroy and two throw pillows, requiring foam that resists bottoming out under concentrated loads.View Product →
Deep, wide seating is a good example of why the numbers have to be read together. A chaise that is generously proportioned needs a foam that resists bottoming out under a concentrated load, which means support factor and compression set carry more weight than raw hardness. A foam that reads firm on a lab platen but has weak recovery will still feel tired after a year of daily use.
Vacuum compression adds one more variable to the picture. Foam that is compressed to a fraction of its volume for shipping depends on its cell structure to spring back, and the same properties that govern compression set also govern recovery. Buyers who want to understand how far shipping volume can be reduced without harming the finished feel can read our notes on how vacuum compression reduces shipping volume.
Frequently Asked Questions About Foam Compression Testing
These are the questions that come up most often from furniture brands, importers and product designers during specification reviews.
What is the difference between IFD and CFD?
IFD uses a small platen on a large specimen, allowing the foam to bulge sideways, which mimics a seated body. CFD loads the whole surface of a smaller specimen with flat plates. IFD describes how a cushion feels; CFD describes how a foam layer behaves inside a structure.
What compression set value should a sofa cushion foam have?
For seating that sees daily use, a set below five percent after the standard heat ageing cycle is a good target. Values between five and ten percent are common in lower cost foam, and anything above ten percent usually signals a durability problem worth investigating.
How long should foam rest before it is tested?
Around 72 hours of maturation is a widely used working rule before specimens are cut, followed by conditioning at controlled temperature and humidity. Testing immediately after production tends to produce softer and less repeatable readings.
Does density determine firmness?
No. Density describes how much material is present in a given volume, while hardness describes how that material resists compression. Two foams with identical density can be produced at very different hardness levels, and two foams with the same hardness can differ substantially in durability.
Which standard applies to sofa cushions in Europe?
European specifications typically reference ISO 2439 for indentation hardness, ISO 3386 for compression load deflection and ISO 1856 for compression set. Results are reported in metric units, and CLD is frequently quoted at 40 percent compression rather than 25 percent.
Can compression testing predict how long a cushion will last?
It cannot predict a service life in years, but it is a strong indicator of relative durability. Compression set combined with density and resilience separates foams that recover well from foams that will take a permanent impression under regular use.
Does vacuum compression change compression performance?
Short term compression does not change the fundamental properties of the foam, provided the formulation is designed for it and the compression ratio is controlled. Recovery speed depends on cell structure, which is why compression set and resilience data are reviewed before a foam is approved for compressed packaging.
What specimen size is used for IFD testing?
ASTM D3574 typically uses a slab specimen of about 380 by 380 by 100 millimetres, indented with a circular platen that is smaller than the specimen. The exact geometry should always be stated in a test report, because platen size and specimen area both influence the result.
Your email address will not be published. Required fields are marked *
-
Vacuum-Compressed Sponge Sofa Dark blue teddy bear velvet light luxury modern modular sofa View More
-
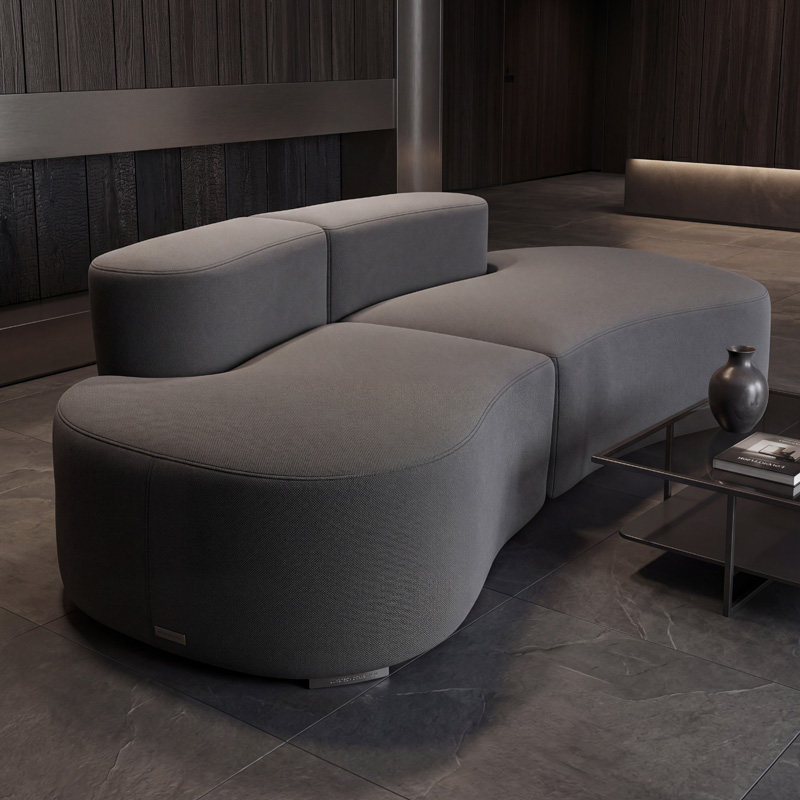
Vacuum-Compressed Sponge Sofa Cloud-like Modular U-shaped Multifunctional Light Luxury Frameless Compression Sofa Bed View More

-
-

-
-


Contact Information
-
 Zhejiang Base: No. 791 Zhangxin North Road, Xiaolin Industrial Park, Cixi City, Ningbo, China
-
Jiangxi Base: Chihu Industrial Park, Jiujiang County, Jiujiang City, Jiangxi Province, China
-
 +86-137-3611-4073
-
 1520942191@qq.com
Quick Link
Copyright © Cixi Tiansheng Sponge Products Co., Ltd. All Rights Reserved
OEM/ODM PU Foam Sponge Couch Manufacturers
